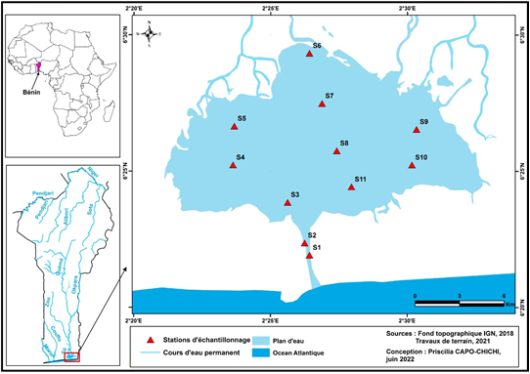
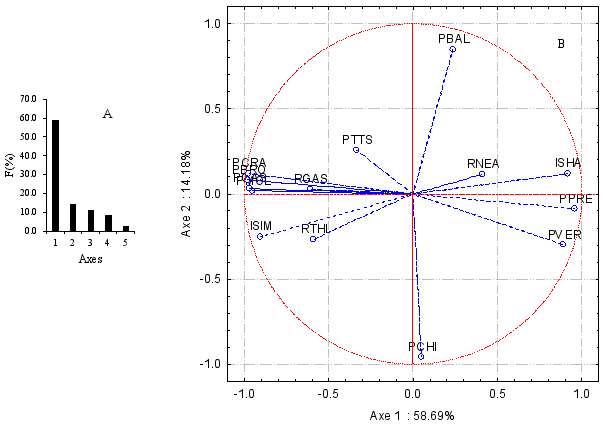
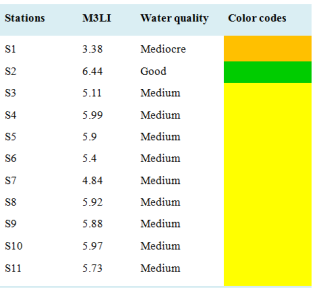
Nowadays, new tools for assessing the biotic integrity of aquatic environments are used. In Benin, the Macroinvertebrate MultiMetric Lake Index (M3LI) was designed to reveal the current state of Lake Nokoué. The inventory was carried out in eight seasonal data collection campaigns from 2019 to 2021 using an Eckman type grab and a trouble net. The composition, diversity and different metrics were calculated. Thirty-nine metrics grouped into five categories were defined and subjected to selection using a PCA in order to identify the relevant metrics for calculating the index. In the lake, 83 taxa divided into 25 orders and 54 families representing 32,770 specimens were determined. Insects, Molluscs, Crustaceans and Annelids constituted the essential macrofauna which was numerically dominated by Gastropods, Crustaceans, Bivalves and Insects. Of the 5 food functional groups obtained, crushers and collector-gatherers were dominant. Ten metrics relevant and well explained by environmental variables were used to calculate M3LI. The M3LI calculated varied from 6.44 at the station near Dantokpa to 3.38 at the Cotonou channel station with fluctuating water quality between poor quality and good quality. These results clearly explain the responses of the living communities of the lake faced with the various stresses due to daily marine intrusion, the role of receptacle of different continental waters and the various anthropogenic activities plunging the environment into a hypereutrophic state. It is therefore urgent to take measures to restoration of this environment to allow living species to regain their balance of life. This index is also a departure for the establishment of a biomonitoring program for the restoration of the lake.
| Published in | International Journal of Environmental Monitoring and Analysis (Volume 12, Issue 5) |
| DOI | 10.11648/j.ijema.20241205.11 |
| Page(s) | 98-110 |
| Creative Commons |
This is an Open Access article, distributed under the terms of the Creative Commons Attribution 4.0 International License (http://creativecommons.org/licenses/by/4.0/), which permits unrestricted use, distribution and reproduction in any medium or format, provided the original work is properly cited. |
| Copyright |
Copyright © The Author(s), 2024. Published by Science Publishing Group |
Lake Nokoué, Benthos, Diversity, Bioindication, Ecological Status
METRICS | Codes | S1 | S2 | S3 | S4 | S5 | S6 | S7 | S8 | S9 | S10 | S11 |
|---|---|---|---|---|---|---|---|---|---|---|---|---|
Taxonomic richness | RTAX | 43 | 42 | 43 | 46 | 42 | 46 | 49 | 36 | 44 | 41 | 42 |
Gastropod richness | RGAS | 8 | 10 | 7 | 9 | 12 | 10 | 14 | 9 | 10 | 8 | 9 |
Bivalves richness | RBIV | 10 | 11 | 10 | 9 | 7 | 8 | 6 | 6 | 9 | 9 | 10 |
Insects richness | RINS | 5 | 8 | 4 | 5 | 7 | 6 | 8 | 6 | 7 | 4 | 6 |
Crustaceans richness | RCRU | 15 | 8 | 14 | 17 | 10 | 13 | 14 | 8 | 11 | 11 | 10 |
Oligochaeta richness | ROLI | 1 | 1 | 1 | 1 | 2 | 2 | 2 | 1 | 1 | 2 | 1 |
Neritidae richness | RNER | 2 | 4 | 1 | 2 | 5 | 4 | 6 | 1 | 2 | 2 | 3 |
Thiaridae richness | RTHI | 3 | 3 | 2 | 2 | 2 | 3 | 3 | 3 | 3 | 2 | 2 |
Gammaridae richness | RGAM | 2 | 2 | 2 | 2 | 2 | 2 | 2 | 0 | 2 | 2 | 2 |
Chironomidae richness | RCHI | 1 | 1 | 1 | 1 | 2 | 1 | 0 | 0 | 1 | 2 | 2 |
Potamididae richness | RPTA | 2 | 2 | 2 | 2 | 2 | 2 | 2 | 2 | 2 | 2 | 2 |
Nereididae richness | RNEA | 2 | 1 | 3 | 2 | 2 | 2 | 1 | 2 | 3 | 3 | 2 |
Percentage Molluscs | PMOL | 69.09 | 93.2 | 57.68 | 61.52 | 90.01 | 88.52 | 81.45 | 89.46 | 87.97 | 87.46 | 77.60 |
Percentage Gastropods | PGAS | 54.57 | 87 | 34.28 | 50.57 | 83.99 | 84.39 | 78.16 | 83.42 | 82.82 | 83.54 | 57.23 |
Percentage Crustaceans | PCRU | 20.32 | 3.36 | 22.53 | 30.5 | 6.11 | 5.29 | 13.47 | 4.10 | 8.26 | 8.93 | 11.38 |
Percentage Insects | PINS | 4.86 | 1.85 | 5.75 | 0.92 | 2.46 | 4.22 | 2.81 | 3.22 | 2.81 | 0.20 | 5.9 |
Percentage Oligochaeta | POLI | 36.71 | 7.59 | 36.71 | 48.1 | 7.59 | 24.05 | 20.25 | 26.58 | 12.66 | 16.46 | 8.86 |
Percentage Worms | PVER | 3.63 | 1.4 | 12.5 | 4.99 | 1.3 | 1.12 | 1.85 | 2.39 | 0.67 | 3.04 | 4.64 |
Percentage Diptera | PDIP | 2.90 | 0.77 | 1.73 | 0.27 | 1.01 | 0.94 | 0.64 | 0.24 | 0.46 | 0.17 | 3.08 |
Percentage Neritidae | PNER | 1.45 | 0.45 | 1.37 | 1.52 | 2.66 | 6.19 | 6.35 | 0.12 | 0.46 | 0.43 | 1.33 |
Percentage Thiaridae | PTHI | 33.24 | 26.10 | 10.17 | 33.93 | 43.07 | 31.85 | 60.5 | 36.74 | 59.29 | 51.72 | 8.36 |
Percentage Gammaridae | PGAM | 4.28 | 0.83 | 7.12 | 5.58 | 0.83 | 1.88 | 1.59 | 0.00 | 1.88 | 0.26 | 1.33 |
Pourcentage Nereididae | PNEI | 2.98 | 0.64 | 10.4 | 3.09 | 0.85 | 0.49 | 0.69 | 0.40 | 0.38 | 1.96 | 2.96 |
Percentage Chironomidae | PCHI | 0.00 | 0.83 | 1.22 | 0.11 | 0.12 | 1.39 | 0.66 | 0.00 | 0.00 | 0.00 | 0.00 |
Percentage Potamididae | PPTA | 19.81 | 60.7 | 21.32 | 14.15 | 36.99 | 46.38 | 11.17 | 46.48 | 22.91 | 31.16 | 47.68 |
Percentage Ostreidae | POST | 5.01 | 4 | 16.9 | 1.27 | 3.09 | 0.54 | 1.33 | 9.07 | 1.34 | 1.32 | 10.48 |
Percentage Sphaeridae | PSPH | 2.61M | 0.46 | 1.96 | 7.54 | 0.24 | 1.8 | 0.53 | 1.48 | 0.76 | 0.91 | 1.87 |
Percentage Balanidae | PBAL | 4.14 | 0.28 | 0.62 | 8.26 | 3.4 | 0.67 | 5.73 | 2.84 | 3.98 | 5.48 | 7.32 |
EC index | EC | 0 | 0 | 0 | 0 | 2 | 0 | 0 | 1 | 1 | 1 | 1 |
Percentage of intolerant taxa | PTTS | 2.33 | 2.38 | 0.00 | 0.00 | 0.00 | 0.00 | 2.04 | 2.78 | 2.27 | 0.00 | 2.38 |
Hilsenhoff Biotic Index | FBI | 7.14 | 7.71 | 6.64 | 6.96 | 7.64 | 7.71 | 7.49 | 7.75 | 7.61 | 7.62 | 7.09 |
Shannon Index | ISHA | 2.93 | 1.64 | 2.85 | 2.66 | 1.94 | 1.89 | 2.05 | 1.97 | 1.82 | 1.94 | 2.46 |
Simpson Index | ISIM | 0.09 | 0.36 | 0.09 | 0.15 | 0.23 | 0.29 | 0.27 | 0.23 | 0.29 | 0.22 | 0.16 |
Margalef Index | IMAR | 5.81 | 4.67 | 5.42 | 5.86 | 4.69 | 5.71 | 5.71 | 4.35 | 5.16 | 4.78 | 5.37 |
Percentage Grinders | PBRO | 40.93 | 47.30 | 32.86 | 38.54 | 46.76 | 47.6 | 45.24 | 46.19 | 47.20 | 45.84 | 40.20 |
Percentage filter-collectors | PFCO | 9.21 | 3.32 | 17.2 | 6.90 | 3.23 | 2.23 | 1.83 | 3.28 | 4.95 | 2.13 | 12.70 |
Percentage Collectors-Gatherers | PCRA | 35.22 | 46.6 | 25.25 | 33.35 | 46.26 | 45.67 | 43.96 | 45.31 | 45.66 | 45.46 | 37.41 |
Percentage Scrapers | PRAC | 7.55 | 0.47 | 10.9 | 11.02 | 0.99 | 1.48 | 3.46 | 0.69 | 1.30 | 1.75 | 1.74 |
Percentage Predators | PPRE | 7.09 | 2.25 | 13.7 | 10.20 | 2.76 | 3.03 | 5.51 | 4.53 | 0.89 | 4.82 | 7.96 |
METRICS | CODES | S1 | S2 | S3 | S4 | S5 | S6 | S7 | S8 | S9 | S10 | S11 |
|---|---|---|---|---|---|---|---|---|---|---|---|---|
Taxonomic richness | RTAX | 0.88 | 0.86 | 0.88 | 0.94 | 0.86 | 0.94 | 1.00 | 0.73 | 0.90 | 0.84 | 0.86 |
Gastropod richness | RGAS | 0.57 | 0.71 | 0.50 | 0.64 | 0.86 | 0.71 | 1.00 | 0.64 | 0.71 | 0.57 | 0.64 |
Bivalves richness | RBIV | 0.91 | 1.00 | 0.91 | 0.82 | 0.64 | 0.73 | 0.55 | 0.55 | 0.82 | 0.82 | 0.91 |
Insects richness | RINS | 0.63 | 1.00 | 0.50 | 0.63 | 0.88 | 0.75 | 1.00 | 0.75 | 0.88 | 0.50 | 0.75 |
Crustaceans richness | RCRU | 0.88 | 0.47 | 0.82 | 1.00 | 0.59 | 0.76 | 0.82 | 0.47 | 0.65 | 0.65 | 0.59 |
Oligochaeta richness | ROLI | 0.50 | 0.50 | 0.50 | 0.50 | 1.00 | 1.00 | 1.00 | 0.50 | 0.50 | 1.00 | 0.50 |
Neritidae richness | RNER | 0.33 | 0.67 | 0.17 | 0.33 | 0.83 | 0.67 | 1.00 | 0.17 | 0.33 | 0.33 | 0.50 |
Thiaridae richness | RTHI | 1.00 | 1.00 | 0.67 | 0.67 | 0.67 | 1.00 | 1.00 | 1.00 | 1.00 | 0.67 | 0.67 |
Gammaridae richness | RGAM | 1.00 | 1.00 | 1.00 | 1.00 | 1.00 | 1.00 | 1.00 | 0.00 | 1.00 | 1.00 | 1.00 |
Chironomidae richness | RCHI | 0.50 | 0.50 | 0.50 | 0.50 | 1.00 | 0.50 | 0.00 | 0.00 | 0.50 | 1.00 | 1.00 |
Potamididae richness | RPTA | 1.00 | 1.00 | 1.00 | 1.00 | 1.00 | 1.00 | 1.00 | 1.00 | 1.00 | 1.00 | 1.00 |
Nereididae richness | RNEA | 0.67 | 0.33 | 1.00 | 0.67 | 0.67 | 0.67 | 0.33 | 0.67 | 1.00 | 1.00 | 0.67 |
Percentage Molluscs | PMOL | 0.74 | 1.00 | 0.66 | 0.66 | 0.96 | 0.95 | 0.87 | 0.96 | 0.94 | 0.94 | 0.83 |
Percentage Gastropods | PGAS | 0.63 | 1.00 | 0.39 | 0.58 | 0.96 | 0.97 | 0.90 | 0.96 | 0.95 | 0.96 | 0.66 |
Percentage Crustaceans | PCRU | 0.67 | 0.11 | 0.74 | 1.00 | 0.20 | 0.17 | 0.44 | 0.13 | 0.27 | 0.29 | 0.37 |
Percentage Insects | PINS | 0.81 | 0.31 | 0.96 | 0.15 | 0.41 | 0.71 | 0.47 | 0.54 | 0.47 | 0.03 | 1.00 |
Percentage Oligochaeta | POLI | 0.76 | 0.14 | 0.76 | 1.00 | 0.14 | 0.49 | 0.41 | 0.54 | 0.25 | 0.33 | 0.17 |
Percentage Worms | PVER | 0.29 | 0.11 | 1.00 | 0.40 | 0.10 | 0.09 | 0.15 | 0.19 | 0.05 | 0.24 | 0.37 |
Percentage Diptera | PDIP | 0.94 | 0.25 | 0.56 | 0.09 | 0.33 | 0.31 | 0.21 | 0.08 | 0.15 | 0.06 | 1.00 |
Percentage Neritidae | PNER | 0.24 | 0.42 | 0.97 | 1.00 | 0.02 | 0.07 | 0.07 | 0.21 | 1.00 | 0.00 | 0.04 |
Percentage Thiaridae | PTHI | 0.56 | 0.71 | 0.53 | 1.00 | 0.61 | 0.98 | 0.85 | 0.14 | 1.00 | 0.00 | 0.01 |
Percentage Gammaridae | PGAM | 1.00 | 0.15 | 0.34 | 0.28 | 0.00 | 0.34 | 0.05 | 0.24 | 1.00 | 0.00 | 0.18 |
Pourcentage Nereididae | PNEI | 1.00 | 0.27 | 0.16 | 0.22 | 0.13 | 0.12 | 0.64 | 0.96 | 1.00 | 0.00 | 0.32 |
Percentage Chironomidae | PCHI | 0.00 | 0.60 | 0.49 | 0.08 | 0.09 | 1.00 | 0.48 | 0.00 | 0.00 | 0.00 | 0.00 |
Percentage Potamididae | PPTA | 0.33 | 1.00 | 0.35 | 0.23 | 0.61 | 0.76 | 0.18 | 0.77 | 0.38 | 0.51 | 0.78 |
Percentage Ostreidae | POST | 0.30 | 0.24 | 1.00 | 0.08 | 0.18 | 0.03 | 0.08 | 0.54 | 0.08 | 0.08 | 0.62 |
Percentage Sphaeridae | PSPH | 0.35 | 0.06 | 0.26 | 1.00 | 0.03 | 0.24 | 0.07 | 0.20 | 0.10 | 0.12 | 0.25 |
Percentage Balanidae | PBAL | 0.50 | 0.03 | 0.08 | 1.00 | 0.41 | 0.08 | 0.69 | 0.34 | 0.48 | 0.66 | 0.89 |
EC index | EC | 0 | 0 | 0 | 0 | 1 | 0 | 0 | 0.5 | 0.5 | 0.5 | 0.5 |
Percentage of intolerant taxa | PTTS | 0.84 | 0.86 | 0.00 | 0.00 | 0.00 | 0.00 | 0.73 | 1.00 | 0.82 | 0.00 | 0.86 |
Hilsenhoff Biotic Index | FBI | 0.92 | 1.00 | 0.86 | 0.90 | 0.99 | 1.00 | 0.97 | 1.00 | 0.98 | 0.98 | 0.92 |
Shannon Index | ISHA | 0.41 | 0.54 | 0.56 | 0.79 | 0.66 | 0.44 | 0.49 | 0.66 | 0.62 | 1.00 | 0.53 |
Simpson Index | ISIM | 0.25 | 1.00 | 0.26 | 0.42 | 0.63 | 0.11 | 0.25 | 0.64 | 0.80 | 0.60 | 0.43 |
Margalef Index | IMAR | 0.99 | 0.80 | 0.92 | 1.00 | 0.80 | 0.97 | 0.97 | 0.74 | 0.88 | 0.82 | 0.92 |
Percentage Grinders | PBRO | 0.86 | 0.99 | 0.69 | 0.81 | 0.98 | 1.00 | 0.95 | 0.97 | 0.99 | 0.96 | 0.84 |
Percentage filter-collectors | PFCO | 0.53 | 0.19 | 1.00 | 0.40 | 0.19 | 0.13 | 0.11 | 0.19 | 0.29 | 0.12 | 0.74 |
Percentage Collectors-Gatherers | PCRA | 0.75 | 1.00 | 0.54 | 0.71 | 0.99 | 0.98 | 0.94 | 0.97 | 0.98 | 0.97 | 0.80 |
Percentage Scrapers | PRAC | 0.69 | 0.04 | 0.99 | 1.00 | 0.09 | 0.13 | 0.31 | 0.06 | 0.12 | 0.16 | 0.16 |
Percentage Predators | PPRE | 0.52 | 0.16 | 1.00 | 0.74 | 0.20 | 0.22 | 0.40 | 0.33 | 0.07 | 0.35 | 0.58 |
Codes | Transp | NO3- | NO2- | NH4+ | PO43- | P-total | Chlorop a |
|---|---|---|---|---|---|---|---|
PTTS | 0.31 | 0.13 | -0.32 | 0.34 | 0.70 | 0.03 | -0.01 |
RGAS | -0.15 | 0.18 | -0.03 | -0.28 | -0.22 | -0.62 | -0.26 |
RTHI | -0.23 | -0.17 | -0.12 | 0.00 | 0.46 | -0.64 | -0.46 |
RNEA | -0.15 | -0.04 | 0.64 | 0.35 | 0.21 | 0.47 | 0.33 |
ISHA | 0.61 | -0.16 | -0.16 | -0.09 | -0.16 | 0.50 | -0.17 |
ISIM | -0.49 | 0.21 | -0.01 | -0.07 | 0.14 | -0.65 | -0.06 |
PMOL | -0.33 | 0.31 | 0.15 | -0.14 | 0.14 | -0.64 | 0.05 |
PGAS | -0.48 | 0.13 | 0.02 | -0.13 | 0.07 | -0.66 | 0.07 |
PCHI | -0.54 | 0.37 | -0.16 | -0.82 | -0.66 | -0.57 | -0.07 |
PBRO | -0.56 | 0.06 | 0.15 | -0.10 | 0.21 | -0.75 | -0.15 |
PCRA | -0.54 | 0.20 | 0.12 | -0.14 | 0.05 | -0.68 | 0.10 |
PPRE | 0.51 | -0.15 | -0.31 | -0.01 | -0.24 | 0.65 | 0.00 |
PVER | 0.50 | -0.03 | -0.37 | 0.00 | -0.29 | 0.65 | 0.16 |
PBAL | 0.65 | -0.58 | -0.22 | 0.55 | 0.02 | 0.61 | -0.19 |
Codes | Axe 1 | Axe 2 |
|---|---|---|
PTTS | -0.34 | 0.26 |
RGAS | -0.59 | 0.03 |
RTHI | -0.59 | -0.26 |
RNEA | 0.41 | 0.12 |
ISHA | 0.92 | 0.12 |
ISIM | -0.91 | -0.25 |
PMOL | -0.95 | 0.02 |
PGAS | -0.97 | 0.03 |
PCHI | 0.05 | -0.96 |
PBRO | -0.98 | 0.08 |
PCRA | -0.98 | 0.12 |
PPRE | 0.96 | -0.09 |
PVER | 0.89 | -0.30 |
PBAL | 0.24 | 0.85 |
Stations | ISHA | ISIM | PMOL | PGAS | PCHI | PBRO | PCRA | PPRE | PVER | PBAL | IM2L |
|---|---|---|---|---|---|---|---|---|---|---|---|
S1 | 0.41 | 0.25 | 0.74 | 0.63 | 0 | 0.56 | 0.45 | 0.22 | 0.09 | 0.03 | 3.38 |
S2 | 0.54 | 1 | 1 | 0.82 | 0.45 | 0.82 | 0.71 | 0.16 | 0.11 | 0.03 | 6.44 |
S3 | 0.56 | 0.26 | 0.62 | 0.31 | 0.78 | 0.49 | 0.44 | 0.57 | 1 | 0.08 | 5.11 |
S4 | 0.79 | 0.42 | 0.66 | 0.48 | 0.08 | 0.71 | 0.71 | 0.74 | 0.4 | 1 | 5.99 |
S5 | 0.66 | 0.63 | 0.96 | 0.96 | 0.09 | 0.98 | 0.91 | 0.2 | 0.1 | 0.41 | 5.9 |
S6 | 0.44 | 0.51 | 0.85 | 0.87 | 1 | 0.76 | 0.68 | 0.12 | 0.09 | 0.08 | 5.4 |
S7 | 0.49 | 0.25 | 0.87 | 0.76 | 0.28 | 0.75 | 0.44 | 0.4 | 0.31 | 0.29 | 4.84 |
S8 | 0.66 | 0.64 | 0.96 | 0.96 | 0 | 0.97 | 0.97 | 0.33 | 0.09 | 0.34 | 5.92 |
S9 | 0.62 | 0.8 | 0.94 | 0.95 | 0 | 0.99 | 0.98 | 0.07 | 0.05 | 0.48 | 5.88 |
S10 | 1 | 0.6 | 0.94 | 0.86 | 0 | 0.96 | 0.56 | 0.35 | 0.24 | 0.46 | 5.97 |
S11 | 0.53 | 0.43 | 0.83 | 0.66 | 0 | 0.84 | 0.8 | 0.58 | 0.37 | 0.69 | 5.73 |
BiOSEL | BIodiversity And Anthropic Pressures On Living Resources Aquatic Of Estuarian And Lagoon Systems Of South BENIN |
GPS | Global Positioning System |
M3LI | Macroinvertebrate MultiMetric Lake Index |
PAG | Government Action Program |
PCA | Principal Component Analysis |
| [1] | Sanogo, S., 2014. Inventory of macroinvertebrates in different water bodies of the Volta Basin for the identification of bioindicator taxa in a continuum of hydro-agricultural dam-effluent-River in Burkina Faso. Single PhD thesis in rural development 198p. |
| [2] | Agblonon Houélome, TM., 2018. Macroinvertébrés et qualité écologique de la rivière Alibori dans le bassin cotonnier du Bénin. [Macroinvertebrates and ecological quality of the Alibori River in the cotton basin of Benin]. Thèse de doctorat, Université d’Abomey-Calavi, Bénin, 289p. |
| [3] |
Karr, JR., 1981. Assessment of Biotic Integrity Using Fish Communities. Fisheries 6, 21-27.
https://doi.org/10.1577/1548-8446(1981)006<0021:AOBIUF>2.0.CO;2 |
| [4] | Barbour, MT., Stribling, JB., Karr, JR., 1995. Multimetric approach for establishing biocriteria and measuring biological condition. In: Davis, W. S., Simon, T. P. (Eds.), Biological Assessment and Criteria: Tools for Water Resources Planning and Decision Making. Lewis Publishers, Boca Raton, Florida pp. 63-77. |
| [5] | Ofenböck, T., Moog, O., Gerritsen, J., Barbour, M., 2004. A stressor specific multimetric approach for monitoring running waters in Austria using benthic macro- invertebrates. Hydrobiologia 516, 251- 268. |
| [6] | Gabriels, W., Lock, K., De Pauw, N., Goethals, PLM., 2010. Multimetric Macroinvertebrate Index Flanders (MMIF) for biological assessment of rivers and lakes in Flanders (Belgium). Limnologica 40, 199-207. |
| [7] | Hering, D., Feld, C. K., Moog, O., Ofenböck, T., 2006. Cook book for the development of a multimetric index for biological condition of aquatic ecosystems: experiences from the European AQEM and STAR projects and related initiatives. Hydrobiologia, 566, 311–324. |
| [8] | Gnohossou, P. M., 2006. La faune benthique d’une lagune ouest africaine (le Lac Nokoué au Bénin), diversité, abondance, variations temporelles et spatiales, place dans la chaîne trophique. [The benthic fauna of a West African lagoon (Lake Nokoué in Benin), diversity, abundance, temporal and spatial variations, place in the trophic chain]. Thèse de Doctorat. Institut National Polytechnique de Toulouse. Formation doctorale: SEVAB. 169 p. |
| [9] | Adandédjan, D., 2012. Diversité et déterminisme des peuplements de macroinvertébrés benthiques de deux lagunes du sud-Bénin: la lagune de Porto-Novo et la lagune côtière. [Diversity and determinism of benthic macroinvertebrate populations in two lagoons in southern Benin: the Porto-Novo lagoon and the coastal lagoon]. Doctorat unique en Sciences Agronomiques de l’université d’Abomey-Calavi, 239 p. |
| [10] | Odountan, H., Abou, Y., 2016. Structure and Composition of Macroinvertebrates during Flood Period of the Nokoue Lake, Benin. Open Journal of Ecology, 2015, 6, 62-73. |
| [11] | Agblonon Houelome, TM., Adandédjan, D., Chikou, A., Imorou Toko, I., Koudenoukpo, C., Bonou, C., Youssao, I., Lalèyè, P., 2017. Inventory and faunal characteristics of macroinvertebrates of the Alibori River in the cotton basin of Benin. International Journal of Innovation and Applied Studies, ISSN 2028-9324 21, 433-448. |
| [12] | Capo-Chichi, H. B. P., Adandédjan, D., Agadjihouèdé, H., Agblonon Houélomè MT., Lalèyè, PA., 2018. Diversity of benthic macroinvertebrates in the Toho-Todougba lagoon complex in Southwest Benin. Bulletin de la Recherche Agronomique du Bénin (BRAD). Special Issue on Sustainable Agricultural Development (DAD)- December 2018. ISSN on paper: 1025-2355. |
| [13] | Gnohossou, P., Lalèyè, P., Atachi, P., Gerino, M., Brosse, S., Moreau, J., 2015. Elaboration of a biotic index of pollution using macroinvertebrates for the monitoring of Lake Nokoué in Benin. Int. J. Biol. Chem. Sci. 9(6): 2897-2917, December 2015. ISSN 1997-342X (Online), ISSN 1991-8631 (Print). |
| [14] | Sossou, P. E., 2019. Vers l’élaboration d’un indice composite benthique de la qualité des eaux: application au Lac Ahémé (Sud-Bénin). [Towards the development of a composite benthic index of water quality: application to Lake Aheme (South Benin)]. Mémoire de Master en Monitoring des Ressources Aquatiques et Aménagement des Pêches Continentales, Université d’Abomey-Calavi. 69p. |
| [15] | Lalèyè, P., 1995. Ecologie de deux espèces de Chrysichthys, poissons siluriformes (Clarotéidae) du complexe Lac Nokoué-Lagune de Porto-Novo au Bénin. [Ecology of two species of Chrysichthys, siluriform fish (Clarotéidae) from the Lake Nokoue-Porto-Novo Lagoon complex in Benin]. Thèse de doctorat, Université du Bénin, 152 p. |
| [16] | Niyonkuru, C., Lalèyè, P., 2010. Impact of acadja fisheries on fish assemblages in Lake Nokoué, Benin, West Africa. Knowledge and Management of Aquatic Ecosystems. 15 p. |
| [17] | Lawani, R., 2013. Evaluation des éléments traces métalliques et spéciation chimique du cuivre et du zinc dans les eaux et sédiments du Lac Nokoué. [Evaluation of trace metal elements and chemical speciation of copper and zinc in the waters and sediments of Lake Nokoue]. Mémoire de Master UAC-FAST. 57 p. |
| [18] | Bossou, M. A., 2013. Analyse des paramètres physico-chimiques de l'eau et des caractéristiques morphologiques et écologiques des populations de Tilapia guineensis (Bleeker, 1962) du Lac Nokoué, du delta de l'Ouémé, de la Lagune de Grand-Popo et du Lac Toho au Sud du Bénin. [Analysis of the physicochemical parameters of water and the morphological and ecological characteristics of populations of Tilapia guineensis (Bleeker, 1962) of Lake Nokoue, the Oueme delta, the Grand-Popo Lagoon and Lake Toho in southern Benin]. Mémoire de Master. EPAC/UAC. 103 p. |
| [19] | Mama, D., 2010. Méthodologie et résultats du diagnostic de l’eutrophisation du Lac Nokoué (Bénin). [Methodology and results of the diagnosis of eutrophication of Lake Nokoue (Benin)]. Thèse de doctorat. 177p. |
| [20] | Barbour, M. T., Gerritsen, J., Snyder, B. D., Stribling, J. B., 1999. Rapid Bioassessment Protocols for Use in Streams and Wadeable Rivers: Periphyton, Benthic Macroinvertebrates and Fish. Second Edition. U. S. Environmental Protection Agency, Office of Water, Washington, DC, USA. WA. EPA 841-B-99-002. |
| [21] | Moisan, J., Pelletier, L., 2011. Protocole d’échantillonnage des macroinvertébrés benthiques d’eau douce du Québec, Cours d’eau peu profonds à substrat meuble 2011. [Sampling protocol for benthic freshwater macroinvertebrates in Quebec, shallow watercourses with soft substrate 2011]. Direction du suivi de l’état de l’environnement, ministère du Développement durable, de l’Environnement et des Parcs, ISBN: 978-2-550-61166-0 (PDF), 39 p. |
| [22] | Gerber, M., Gabriel, M. J. M., 2002. Aquatic Invertebrates of South African Rivers (Version 2). Institut for water Quality Studies, Departement Affairs and Forestry. Ressource Quality Services Department of water Affairs Private.14p. |
| [23] | Van Vondel, B. J., 2005. Water beetlesfrom Bénin (Coleoptera: Haliplidae, Dytiscidae, Noteridae, Hydraenidae, Hydrochidae, Hydrophilidae, Gyrinidae, Elmidae) – DEINSEA, 11: 119-138. |
| [24] | Yapo, M. L., Atse, B. C., Kouassi, P., 2012. Inventaire des insectes aquatiques des étangs piscicoles au Sud de la Côte d’ivoire. [Inventory of aquatic insects in fish ponds in southern Ivory Coast]. Journal of Applied Biosciences 58: 4208–4222. |
| [25] | Moisan, J., 2010. Guide d’identification des principaux macroinvertébrés benthiques d’eau douce du Québec, 2010. [Identification guide to the main freshwater benthic macroinvertebrates of Quebec, 2010]. Surveillance volontaire des cours d’eau peu profonds, Direction du suivi de l’état de l’environnement, ministère du Développement durable, de l’Environnement et des Parcs, ISBN: 978-2-550-58416-2, 82 p. |
| [26] | Tachet, H., Richoux, P., Bourneau, M., Usseglio-Polatera, P., 2006. Invertébrés d’eau douce, systémétique, biologie, écologie. [Freshwater invertebrates, systematics, biology, ecology]. CNRS Editions, Paris. 587 p. |
| [27] | Kaboré, I., 2016. Benthic invertebrate assemblages and assessment of ecological status of water bodies in the Sahelo Soudanian area (Burkina Faso, West Africa). Doctorat Thesis. University of Natural Resources and Life Sciences, Vienna Austria. 242p. |
| [28] | Tampo, L., Lazar, IM., Kaboré, I., Oueda, A., Akpataku, KV., Djaneye- Boundjou, G., Bawa, LM., Lazar, G., Guenda, W., 2020. A multimetric index for assessment of aquatic ecosystem health based on macroinvertebrates for the Zio river basin in Togo, Limnologica 83 (2020) 125783. |
| [29] | Bode, R. W., Novak, M. A., Abele, L. E., Heitzman, D. L., Smith, A. J., 2002. Quality Assurance Work Plan for Biological Stream Monitoring in New York State, Albany (New York), Stream Biomonitoring Unit Bureau of Water Assessment and Management Division of Water, NYS Department of Environmental Conservation, 41p. |
| [30] | Moisan J., Pelletier L. 2008. Guide de surveillance biologique basée sur les macroinvertébrés benthiques d’eau douce du Québec – Cours d’eau peu profonds à substrat grossier, 2008. [Biological monitoring guide based on freshwater benthic macroinvertebrates in Quebec – Shallow watercourses with coarse substrate, 2008]. Direction du suivi de l’état de l’environnement, ministère du Développement durable, de l’Environnement et des Parcs, Québec, Canada. |
| [31] | Nyamsi Tchatcho, N. L., Foto Menbohan, S., Zébazé Togouet, S. H., Onana Fils, M., Adandedjan, D., Tchakonté, S., Yémélé Tsago, C., Koji, E., Njiné, T., 2014. Indice Multimétrique des Macroinvertébrés Benthiques Yaoundéens (IMMY) Pour L'évaluation Biologique de la Qualité des Eaux de Cours D'eau de la Région du Centre Sud Forestier du Cameroun. [Multimetric Index of Yaoundean Benthic Macroinvertebrates (IMMY) for the Biological Assessment of Water Quality in Streams of the South-Central Forest Region of Cameroon]. European Journal of Scientific Research, ISSN 1450-216X / 1450-202X Vol. 123 No 4 June, 2014, pp. 412-430. |
| [32] | Karr, JR., Chu, EW., 1999. Restoring life in running waters. Better Biological. Monitoring. Island Press, Washington, DC. |
| [33] | Kengne Fotsing, J., 2018. Bio-assessment of watercourses in the West region of Cameroon using benthic macroinvertebrates and construction of a regional multimetric index. Doctoral thesis, University of Lille, 222p. |
| [34] | Edegbene, AO., Elakhame, LA., Arimoro, FO., Osimen, EC., Odume, ON., 2019. Development of macroinvertebrates multimetric index for ecological evaluation of a river in North Central Nigeria. Environmental Monitoring and Assessment 191, 274. |
APA Style
Capo-Chichi, H. B. P., Adandedjan, D., Houelome, T. M. A., Laleye, P. A., Chikou, A., et al. (2024). Development of a Macroinvertebrate Multimetric Index for the Evaluation of the Ecological Quality of Lake Nokoué. International Journal of Environmental Monitoring and Analysis, 12(5), 98-110. https://doi.org/10.11648/j.ijema.20241205.11
ACS Style
Capo-Chichi, H. B. P.; Adandedjan, D.; Houelome, T. M. A.; Laleye, P. A.; Chikou, A., et al. Development of a Macroinvertebrate Multimetric Index for the Evaluation of the Ecological Quality of Lake Nokoué. Int. J. Environ. Monit. Anal. 2024, 12(5), 98-110. doi: 10.11648/j.ijema.20241205.11
@article{10.11648/j.ijema.20241205.11,
  author = {Houéyi Bénédicta Priscilia Capo-Chichi and Delphine Adandedjan and Thierry Matinkpon Agblonon Houelome and Philippe Adédjobi Laleye and Antoine Chikou and Christophe Kaki and Hyppolite Agadjihouede},
  title = {Development of a Macroinvertebrate Multimetric Index for the Evaluation of the Ecological Quality of Lake Nokoué
},
  journal = {International Journal of Environmental Monitoring and Analysis},
  volume = {12},
  number = {5},
  pages = {98-110},
  doi = {10.11648/j.ijema.20241205.11},
  url = {https://doi.org/10.11648/j.ijema.20241205.11},
  eprint = {https://article.sciencepublishinggroup.com/pdf/10.11648.j.ijema.20241205.11},
  abstract = {Nowadays, new tools for assessing the biotic integrity of aquatic environments are used. In Benin, the Macroinvertebrate MultiMetric Lake Index (M3LI) was designed to reveal the current state of Lake Nokoué. The inventory was carried out in eight seasonal data collection campaigns from 2019 to 2021 using an Eckman type grab and a trouble net. The composition, diversity and different metrics were calculated. Thirty-nine metrics grouped into five categories were defined and subjected to selection using a PCA in order to identify the relevant metrics for calculating the index. In the lake, 83 taxa divided into 25 orders and 54 families representing 32,770 specimens were determined. Insects, Molluscs, Crustaceans and Annelids constituted the essential macrofauna which was numerically dominated by Gastropods, Crustaceans, Bivalves and Insects. Of the 5 food functional groups obtained, crushers and collector-gatherers were dominant. Ten metrics relevant and well explained by environmental variables were used to calculate M3LI. The M3LI calculated varied from 6.44 at the station near Dantokpa to 3.38 at the Cotonou channel station with fluctuating water quality between poor quality and good quality. These results clearly explain the responses of the living communities of the lake faced with the various stresses due to daily marine intrusion, the role of receptacle of different continental waters and the various anthropogenic activities plunging the environment into a hypereutrophic state. It is therefore urgent to take measures to restoration of this environment to allow living species to regain their balance of life. This index is also a departure for the establishment of a biomonitoring program for the restoration of the lake.
},
 year = {2024}
}
TY  - JOUR
T1  - Development of a Macroinvertebrate Multimetric Index for the Evaluation of the Ecological Quality of Lake Nokoué

AU  - Houéyi Bénédicta Priscilia Capo-Chichi
AU  - Delphine Adandedjan
AU  - Thierry Matinkpon Agblonon Houelome
AU  - Philippe Adédjobi Laleye
AU  - Antoine Chikou
AU  - Christophe Kaki
AU  - Hyppolite Agadjihouede
Y1  - 2024/09/20
PY  - 2024
N1  - https://doi.org/10.11648/j.ijema.20241205.11
DO  - 10.11648/j.ijema.20241205.11
T2  - International Journal of Environmental Monitoring and Analysis
JF  - International Journal of Environmental Monitoring and Analysis
JO  - International Journal of Environmental Monitoring and Analysis
SP  - 98
EP  - 110
PB  - Science Publishing Group
SN  - 2328-7667
UR  - https://doi.org/10.11648/j.ijema.20241205.11
AB  - Nowadays, new tools for assessing the biotic integrity of aquatic environments are used. In Benin, the Macroinvertebrate MultiMetric Lake Index (M3LI) was designed to reveal the current state of Lake Nokoué. The inventory was carried out in eight seasonal data collection campaigns from 2019 to 2021 using an Eckman type grab and a trouble net. The composition, diversity and different metrics were calculated. Thirty-nine metrics grouped into five categories were defined and subjected to selection using a PCA in order to identify the relevant metrics for calculating the index. In the lake, 83 taxa divided into 25 orders and 54 families representing 32,770 specimens were determined. Insects, Molluscs, Crustaceans and Annelids constituted the essential macrofauna which was numerically dominated by Gastropods, Crustaceans, Bivalves and Insects. Of the 5 food functional groups obtained, crushers and collector-gatherers were dominant. Ten metrics relevant and well explained by environmental variables were used to calculate M3LI. The M3LI calculated varied from 6.44 at the station near Dantokpa to 3.38 at the Cotonou channel station with fluctuating water quality between poor quality and good quality. These results clearly explain the responses of the living communities of the lake faced with the various stresses due to daily marine intrusion, the role of receptacle of different continental waters and the various anthropogenic activities plunging the environment into a hypereutrophic state. It is therefore urgent to take measures to restoration of this environment to allow living species to regain their balance of life. This index is also a departure for the establishment of a biomonitoring program for the restoration of the lake.

VL  - 12
IS  - 5
ER  -
Department of Hydrobiology and Aquaculture, Faculty of Agronomic Sciences, Abomey-Calavi, Benin